<?xml version="1.0" encoding="utf-8"?><feed xmlns="http://www.w3.org/2005/Atom" ><generator uri="https://jekyllrb.com/" version="3.10.0">Jekyll</generator><link href="https://lewistonface.com/feed.xml" rel="self" type="application/atom+xml" /><link href="https://lewistonface.com/" rel="alternate" type="text/html" /><updated>2026-07-04T14:25:01+00:00</updated><id>https://lewistonface.com/feed.xml</id><title type="html">LewistonFace</title><subtitle>Lewiston Face Artwork</subtitle><author><name>Eric Lewiston</name></author><entry><title type="html">Plotter Post Processing</title><link href="https://lewistonface.com/svg%20processing/plotter-post-processing/" rel="alternate" type="text/html" title="Plotter Post Processing" /><published>2024-05-08T00:00:00+00:00</published><updated>2024-05-08T00:00:00+00:00</updated><id>https://lewistonface.com/svg%20processing/plotter-post-processing</id><content type="html" xml:base="https://lewistonface.com/svg%20processing/plotter-post-processing/"><![CDATA[<h1 id="my-application">My application!</h1>
<p>I’ve been slowly building out a GUI that aids in quickly and easily processing svgs for plotting. It uses <a href="https://github.com/abey79/vpype">Vpype</a> to actually do the processing, but wraps many Vpype functions up in easy to use GUIs.</p>

<h2 id="why">Why?</h2>
<p>The main reason I created this is because I typically use a lot of the same Vpype commmands for every file, and I have defaults set so that I usually don’t have to do much of anything except to hit the “Confirm” button.</p>

<h3 id="why-else">Why else?</h3>
<p>The other reasons that have become clear over time are that Vpype is difficult to craft complex recipes by hand, and having a script that creates the code is a lot simpler in the long haul. Doing things like adding in dipping patterns becomes trivial when presented with a few simple checkbox/dropdown options.</p>

<h2 id="where">Where?</h2>
<p>The code can be found at my <a href="https://github.com/lewi0622/Plotter-Post-Processing">github repo</a>. I’m still in the process of updating and improving it, and I plan to do separate blog posts for the different utilities. So keep an eye out.</p>]]></content><author><name>Eric Lewiston</name></author><category term="SVG Processing" /><category term="Vpype" /><category term="Plotter-Post-Processing" /><summary type="html"><![CDATA[My application! I’ve been slowly building out a GUI that aids in quickly and easily processing svgs for plotting. It uses Vpype to actually do the processing, but wraps many Vpype functions up in easy to use GUIs.]]></summary></entry><entry><title type="html">Coloring by Drawing Order</title><link href="https://lewistonface.com/svg%20processing/coloring-by-drawing-order/" rel="alternate" type="text/html" title="Coloring by Drawing Order" /><published>2024-05-07T00:00:00+00:00</published><updated>2024-05-07T00:00:00+00:00</updated><id>https://lewistonface.com/svg%20processing/coloring-by-drawing-order</id><content type="html" xml:base="https://lewistonface.com/svg%20processing/coloring-by-drawing-order/"><![CDATA[<h1 id="coloring-by-drawing-order">Coloring by Drawing Order</h1>

<p>In most of my digital designs (done in p5.js), I use the random function to assign colors for lines. I have a palette of pre-defined colors that I know work well together, and simply pick from that. Occasionally, I’ll use noise values based on the X,Y coordinates of a given line/shape to determine it’s color, this results in clumps of color that vary with the underlying noise values.</p>

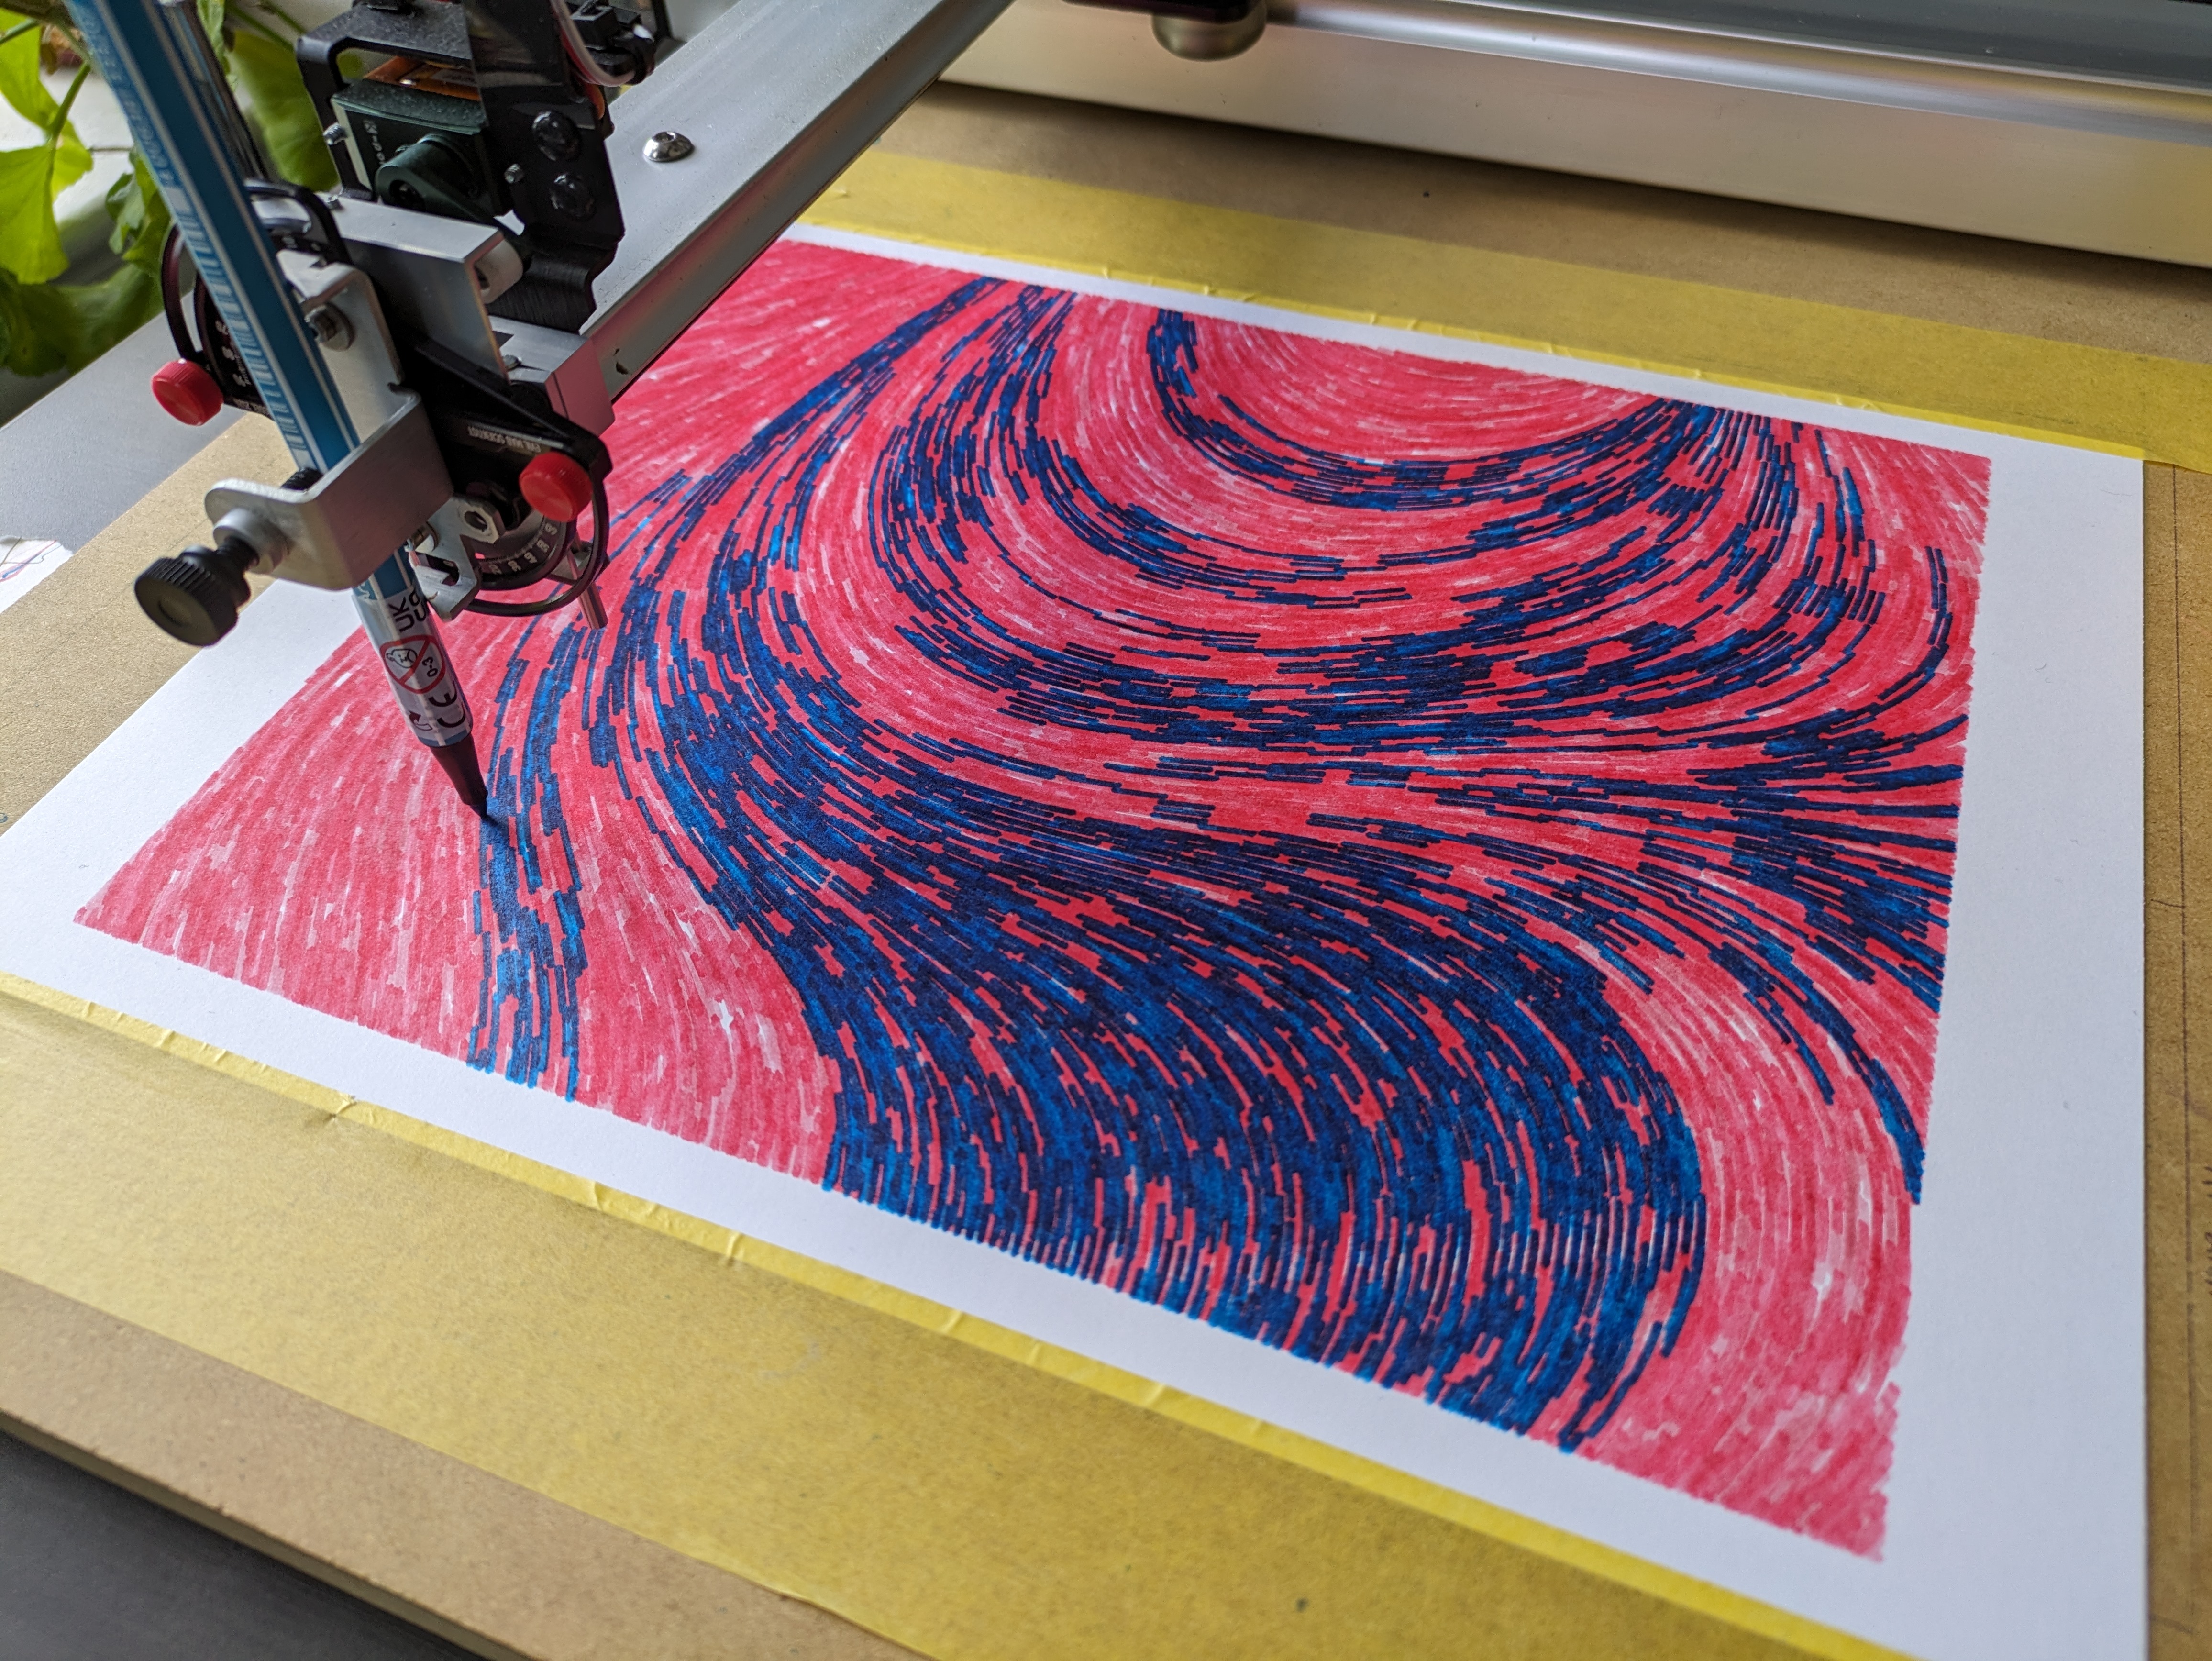
<p>While plotting one of my <a href="https://lewistonface.com/design/flow-fields/">Flow Fields</a>, I realized on the last layer, that I really liked how it was looking with only partially coverage. The line sorting algorithm had picked out these big chunks of the deisgn, and resulted in some beautiful art!</p>
<p align="center">
  <img src="https://lewistonface.com/assets/images/Partially_Finished_Plot.jpg" />
</p>

<h2 id="recoloring-a-multicolor-design">Recoloring a multicolor design</h2>
<p>This gave me an idea of how to color or re-color my designs, using Vpype’s linesort algorithm as it’s base. Here’s the steps I came up with to try and recreate what had accidentally occured.</p>
<ol>
  <li>Post process the file with linesort</li>
  <li>Take one color layer and split it into chunks (three in this example)
    <div class="language-bash highlighter-rouge"><div class="highlight"><pre class="highlight"><code>...
splitdist 20in <span class="se">\</span>
forlayer <span class="se">\</span>
lmove %_lid% <span class="s2">"%_i%%3+1%"</span> <span class="se">\</span>
end <span class="se">\</span>
...
</code></pre></div>    </div>
  </li>
</ol>

<p>Playing around with the number of layers and the split distance can give varying results, but the important thing is the lines are now grouped into layers based not on some random value, but by how close the start/end of the lines are</p>

<h2 id="recoloring-a-single-color-design">Recoloring a single color design</h2>
<p>Here’s an example of using the above code to recolor a single-color flow field design into pleasing clumps of color.</p>

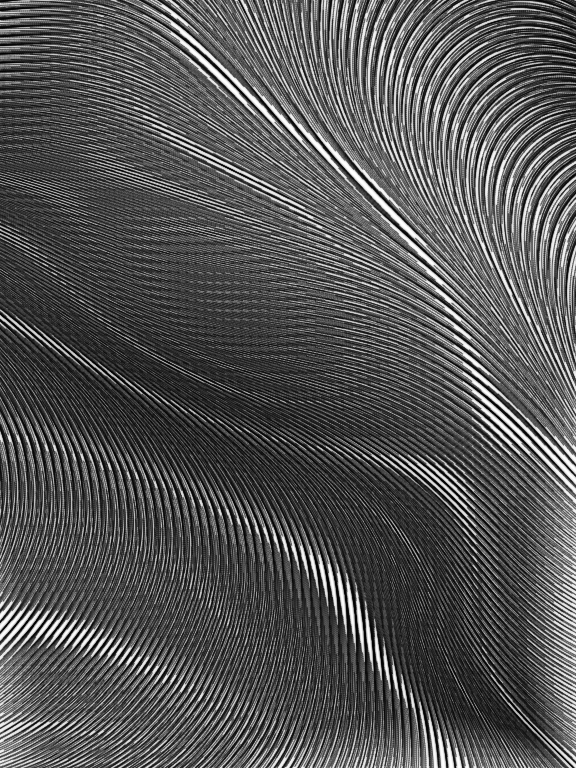
<h3 id="base-design">Base design:</h3>
<p align="center">
  <img src="https://lewistonface.com/assets/images/Single_Color_Flow_Field.png" />
</p>

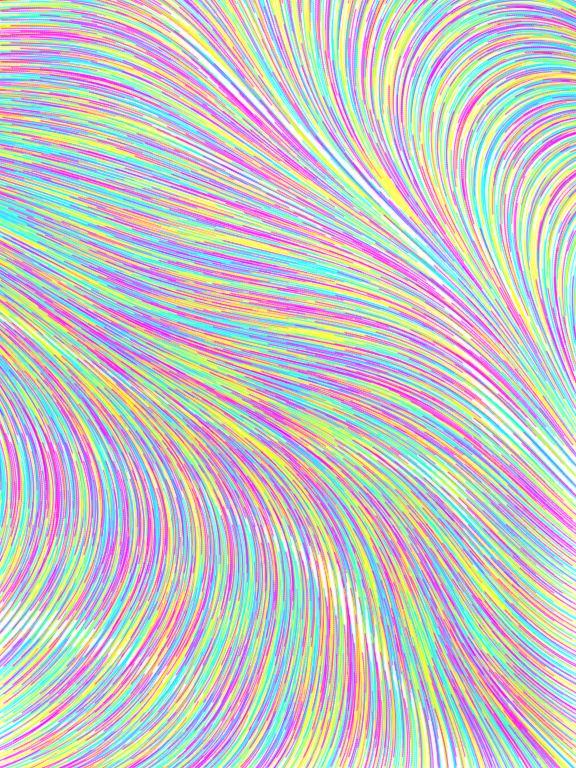
<h3 id="design-if-there-to-use-random-cmy-colors">Design if there to use random CMY colors:</h3>
<p align="center">
  <img src="https://lewistonface.com/assets/images/Flow_Field_CMY.png" />
</p>

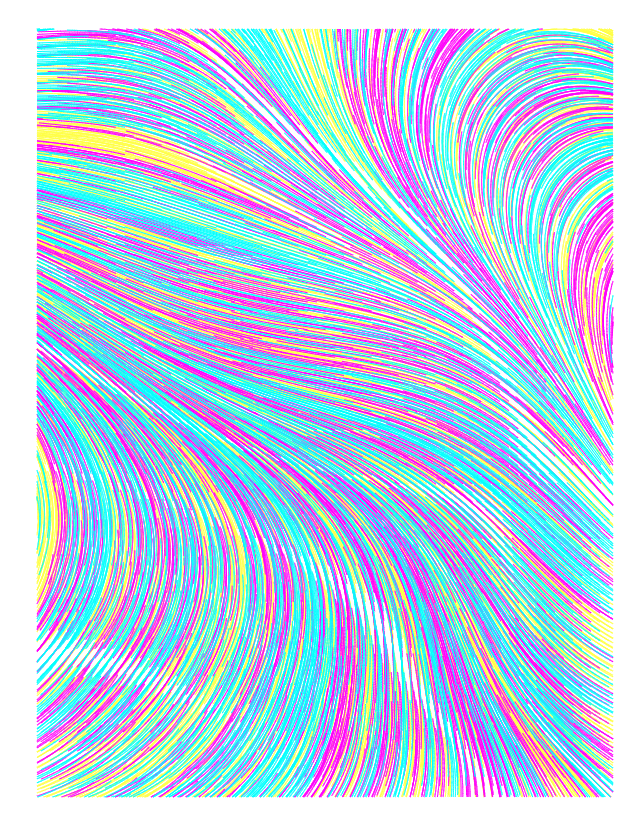
<h3 id="design-after-using-linesort-and-splitdist">Design after using linesort and splitdist:</h3>
<p align="center">
  <img src="https://lewistonface.com/assets/images/Flow_Field_linesort_splitdist.png" />
</p>

<p>While both look nice, I like the grouping provided by the linesort/splitdist a little more, I think it looks more organic and adds to the flowy nature of the design.</p>]]></content><author><name>Eric Lewiston</name></author><category term="SVG Processing" /><category term="Vpype" /><summary type="html"><![CDATA[Coloring by Drawing Order]]></summary></entry><entry><title type="html">Flow Fields</title><link href="https://lewistonface.com/design/flow-fields/" rel="alternate" type="text/html" title="Flow Fields" /><published>2024-04-03T00:00:00+00:00</published><updated>2024-04-03T00:00:00+00:00</updated><id>https://lewistonface.com/design/flow-fields</id><content type="html" xml:base="https://lewistonface.com/design/flow-fields/"><![CDATA[<h1 id="flow-fields">Flow Fields</h1>

<p align="center">
  <img src="https://lewistonface.com/assets/images/flow-fields/Flow_Field_20copy_seed_147274_colors_6_scale_1.png" />
</p>

<p>Flow fields are two dimensional Perlin Noise fields, and to my mind, often considered passé in the generative art community. Perhaps because of that reason,  I’ve been avoiding them for some time. A while back I played with the flow field code from <a href="https://www.youtube.com/watch?v=BjoM9oKOAKY">The Coding Train</a>, but I never did much with it.</p>

<p align="center">
  <img src="https://lewistonface.com/assets/images/flow-fields/Flow_Field_20copy_seed_209131_colors_6_scale_1.png" />
</p>

<p>With all the work I’ve been doing with Perlin Noise generally, something clicked with me and I understood how to make a flow field using my own code, and not with the templates I’d previously seen. It always makes more sense when you do it for yourself.</p>

<p align="center">
  <img src="https://lewistonface.com/assets/images/flow-fields/Flow_Field_20copy_seed_600582_colors_6_scale_1.png" />
</p>

<p>My flow field code is simply rows/columnns of points, and then per point, a number of iterations move in the direction of the angle given from the noise field. These iterations are the vertices in each line. I experimented with random point placement, but enjoy the coverage of the grids/rows, and I could always offest those by a random displacment to make it less regular looking.</p>

<p align="center">
  <img src="https://lewistonface.com/assets/images/flow-fields/Flow_Field_20copy_seed_952611_colors_6_scale_1.png" />
</p>

<p>Here’s the first one I plotted, using Lyra Aqua Brush Duo watercolor markers on smooth bristol.</p>

<p align="center">
  <img src="https://lewistonface.com/assets/images/flow-fields/Flow-Field-Plotted.jpg" />
</p>

<p>As per usual, you can find my code on <a href="https://github.com/lewi0622/lewi0622.github.io/blob/master/plotter_projects/Flow_Field/sketch.js">my github</a>.</p>]]></content><author><name>Eric Lewiston</name></author><category term="Design" /><category term="p5js" /><summary type="html"><![CDATA[Flow Fields]]></summary></entry><entry><title type="html">Files Too Big For Saxi</title><link href="https://lewistonface.com/svg%20processing/files-too-big-for-saxi/" rel="alternate" type="text/html" title="Files Too Big For Saxi" /><published>2024-03-31T00:00:00+00:00</published><updated>2024-03-31T00:00:00+00:00</updated><id>https://lewistonface.com/svg%20processing/files-too-big-for-saxi</id><content type="html" xml:base="https://lewistonface.com/svg%20processing/files-too-big-for-saxi/"><![CDATA[<h1 id="files-too-big-for-saxi">Files Too Big For Saxi</h1>
<p>I have used <a href="https://github.com/nornagon/saxi">Saxi</a> for a long time to control my AxiDraw pen plotter. I’ve found Saxi’s user interface to be easy to use, its allowed me to stay away from Inkscape (yay!), and you can easily select layers or colors to plot individually. Additionally, I have it running on a Raspberry Pi, so it’s not tethered to my desktop computer!</p>
<h2 id="the-problem">The Problem</h2>
<p>But, there are some files which are too large, and simply fail to start plotting. For me that seems to happen around plot times of 2 hours. Looking at the output from Saxi, I see:</p>

<p>FATAL ERROR: Reached heap limit Allocation failed - JavaScript heap out of memory
Aborted</p>

<p>Likely this is a Raspberry Pi memory issue, and not a Saxi issue, as I haven’t heard anyone else complain that it fails on longer plots.</p>

<p>But I think we can develop a workaround! Using Vpype, I will split a single color file into equal n layers. This is an operation I could do in the design within p5.js if desired, but seems like a good general purpose solution when I run into this particular problem.</p>
<h2 id="the-recipe">The Recipe</h2>
<p>Let’s try and hard code a small and easy demo to use with Vpype.</p>
<div class="language-bash highlighter-rouge"><div class="highlight"><pre class="highlight"><code>vpype <span class="se">\</span>
<span class="nb">eval</span> <span class="s2">"%num_layers=int(input('Number of Layers: '))%"</span> <span class="se">\</span>
<span class="nb">read</span> <span class="nt">-a</span> d <span class="nt">-a</span> points <span class="nt">--no-crop</span> <span class="s1">'Demo.svg'</span> <span class="se">\</span>
forlayer <span class="se">\</span>
lmove %_lid% <span class="s2">"%_lid%%num_layers+1%"</span> <span class="se">\</span>
end <span class="se">\</span>
linesort <span class="se">\</span>
show
</code></pre></div></div>
<p>Let’s step thru this code and explain it piece by piece:</p>
<ol>
  <li>eval…
    <ol>
      <li>Using the python input function, we ask the user for the number of layers to split the design into, and store that variable for future use.</li>
    </ol>
  </li>
  <li>read -a d…
    <ol>
      <li>Here we are reading in our file and sorting into layers based on attribute “d” which is the SVG attribute for path information; and “points” which is the standard attribute generated by Vpype. I’m not sure these attributes are exhaustive, but it’s done a good job with the files I’ve tried so far. As long as we don’t have any duplicate paths, each path will get it’s own layer.</li>
    </ol>
  </li>
  <li>forlayer
    <ol>
      <li>A <a href="https://vpype.readthedocs.io/en/latest/fundamentals.html#block-processor-commands">Block Processor</a> command, this loops through every layer in the design we just read in. It needs an end command to mark the end of the for loop.</li>
    </ol>
  </li>
  <li>lmove
    <ol>
      <li>This command moves the current layer to a new layer.</li>
      <li>Normally, the percent sign is used in <a href="https://vpype.readthedocs.io/en/latest/fundamentals.html#expression-substitution">expression substitution in Vpype</a>. But in addition to the outer %s for expression substitution, we are also using the percent sign as the modulo operator by using two percent signs in succession, one escaping the other.  Lastly, we are adding one to the result of the modulo operation, as Vpype does not accept layer ids equal to zero.</li>
      <li>In this example, we expect to see _lid = 1,2,3,4,5,6… and the new layer id to be 2,3,4,1,2,3… in response. It only irks me slightly that we don’t start on layer 1, but it doesn’t really matter.</li>
    </ol>
  </li>
  <li>linesort
    <ol>
      <li>We’re sorting the lines here, as any previous optimization is likely no longer as effective.</li>
    </ol>
  </li>
</ol>

<h2 id="imperfections">Imperfections</h2>
<p>The only real issue with this workaround is the need to manually start each new layer. Ideally one would be able to press play on a four hour plot, rather than need to press play on 4x one hour plots. Likely a more robust solution is needed, especially if I transition to a larger plotter. Another issue is that the plot time increases by a decent amount since I can’t optimize across the whole design.</p>]]></content><author><name>Eric Lewiston</name></author><category term="SVG Processing" /><category term="Vpype" /><category term="Saxi" /><summary type="html"><![CDATA[Files Too Big For Saxi I have used Saxi for a long time to control my AxiDraw pen plotter. I’ve found Saxi’s user interface to be easy to use, its allowed me to stay away from Inkscape (yay!), and you can easily select layers or colors to plot individually. Additionally, I have it running on a Raspberry Pi, so it’s not tethered to my desktop computer! The Problem But, there are some files which are too large, and simply fail to start plotting. For me that seems to happen around plot times of 2 hours. Looking at the output from Saxi, I see:]]></summary></entry><entry><title type="html">Creating Dimension Responsive Designs in p5.js</title><link href="https://lewistonface.com/design/creating-dimension-responsive-designs-in-p5js/" rel="alternate" type="text/html" title="Creating Dimension Responsive Designs in p5.js" /><published>2024-03-24T00:00:00+00:00</published><updated>2024-03-24T00:00:00+00:00</updated><id>https://lewistonface.com/design/creating-dimension-responsive-designs-in-p5js</id><content type="html" xml:base="https://lewistonface.com/design/creating-dimension-responsive-designs-in-p5js/"><![CDATA[<h1 id="creating-dimension-responsive-designs-in-p5js">Creating Dimension Responsive Designs in p5.js</h1>
<p>For a long time now, I’ve used a custom scale factor which, applied to certain parameters, allows me to easily scale up/down a design to a desired resolution. But this always was under the assumption that the aspect ratio of the design (ratio of canvas width and height) would remain about the same.</p>

<p>For the most part, I’ve created square designs, and in doing so haven’t always been great at differentiating between the width and height because it was always the same!</p>

<p>Recently I introduced new parameters to my p5.js framework:</p>
<blockquote>
  <p>smaller_base and larger_base:
the unscaled pixel value of the smaller/larger canvas dimension</p>
</blockquote>

<p>This requires a fundamental rethinking of how I design my sketches. For example, if I was to create a square centered in the canvas, I might say:</p>
<div class="language-javascript highlighter-rouge"><div class="highlight"><pre class="highlight"><code>  <span class="nx">rectMode</span><span class="p">(</span><span class="nx">CENTER</span><span class="p">);</span>
  <span class="nx">translate</span><span class="p">(</span><span class="nx">width</span><span class="o">/</span><span class="mi">2</span><span class="p">,</span> <span class="nx">height</span><span class="o">/</span><span class="mi">2</span><span class="p">);</span>
  <span class="nx">square</span><span class="p">(</span><span class="mi">0</span><span class="p">,</span><span class="mi">0</span><span class="p">,</span> <span class="nx">width</span><span class="o">/</span><span class="mi">2</span><span class="p">);</span>
</code></pre></div></div>

<p><img src="https://lewistonface.com/assets/images/Square_1_1_ratio.png" alt="Square_1_1_ratio" /></p>

<p>You might say this is good enough! It changes when the design width changes, and always stays centered. But what if the aspect ratio goes from 1:1 to 4:1?</p>

<p><img src="https://lewistonface.com/assets/images/Square_4_1_ratio.png" alt="Square_4_1_ratio" /></p>

<p>Hmm, not really what we want out of this sketch, we wanted to see a square centered, and while that’s technically still what’s happening, the square is getting cut off.</p>

<p>Let’s add our new variables for smaller and larger base values in our setup function and assign them programmatically.</p>
<div class="language-javascript highlighter-rouge"><div class="highlight"><pre class="highlight"><code><span class="kd">let</span> <span class="nx">smaller_base</span><span class="p">,</span> <span class="nx">larger_base</span><span class="p">;</span>
<span class="kd">function</span> <span class="nx">setup</span><span class="p">()</span> <span class="p">{</span>
  <span class="kd">const</span> <span class="nx">base_x</span> <span class="o">=</span> <span class="mi">400</span><span class="p">;</span>
  <span class="kd">const</span> <span class="nx">base_y</span> <span class="o">=</span> <span class="mi">100</span><span class="p">;</span>
  <span class="nx">createCanvas</span><span class="p">(</span><span class="nx">base_x</span><span class="p">,</span> <span class="nx">base_y</span><span class="p">);</span> 
  <span class="nx">smaller_base</span> <span class="o">=</span> <span class="nx">base_x</span><span class="p">;</span>
  <span class="nx">larger_base</span> <span class="o">=</span> <span class="nx">base_y</span><span class="p">;</span>
  <span class="k">if</span><span class="p">(</span><span class="nx">smaller_base</span> <span class="o">&gt;</span> <span class="nx">larger_base</span><span class="p">){</span>
    <span class="nx">smaller_base</span> <span class="o">=</span> <span class="nx">base_y</span><span class="p">;</span>
    <span class="nx">larger_base</span> <span class="o">=</span> <span class="nx">base_x</span><span class="p">;</span>
  <span class="p">}</span>
<span class="p">}</span>
</code></pre></div></div>

<p>Now how does that handle our 4:1 ratio?</p>

<p><img src="https://lewistonface.com/assets/images/Square_4_1_ratio_fixed.png" alt="Square_4_1_ratio_fixed" /></p>

<p>Much better, what about a 1:4 ratio?</p>

<p><img src="https://lewistonface.com/assets/images/Square_1_4_ratio.png" alt="Square_1_4_ratio" /></p>

<p>Perfect!</p>

<p>For me, this is going to require rewriting some of my earlier code, but it will be worth it when I want to generate a phone wallpaper from a square design, and not have to write code for specific size or ratio based corner cases.</p>

<p>See and edit the code used for this example <a href="https://editor.p5js.org/lewi0622/sketches/DaXHaDd_9">here</a>.</p>]]></content><author><name>Eric Lewiston</name></author><category term="Design" /><category term="p5js" /><summary type="html"><![CDATA[Creating Dimension Responsive Designs in p5.js For a long time now, I’ve used a custom scale factor which, applied to certain parameters, allows me to easily scale up/down a design to a desired resolution. But this always was under the assumption that the aspect ratio of the design (ratio of canvas width and height) would remain about the same.]]></summary></entry><entry><title type="html">Vpype Grid Colors</title><link href="https://lewistonface.com/svg%20processing/Vpype-Grid-Colors/" rel="alternate" type="text/html" title="Vpype Grid Colors" /><published>2024-03-23T00:00:00+00:00</published><updated>2024-03-23T00:00:00+00:00</updated><id>https://lewistonface.com/svg%20processing/Vpype-Grid-Colors</id><content type="html" xml:base="https://lewistonface.com/svg%20processing/Vpype-Grid-Colors/"><![CDATA[<h1 id="vpype-grid">Vpype Grid</h1>
<p>I ran into an issue when implementing the <a href="https://vpype.readthedocs.io/en/latest/reference.html#grid">Grid</a> command in <a href="https://github.com/abey79/vpype">Vpype</a>. When pulling in multiple files, it would often place them onto the same layers, thereby overwriting whatever color was assigned to that layer. In multi-color plots, this was a problem!</p>
<h2 id="grid-recipe">Grid Recipe</h2>
<p>Here’s my solution for maintaining colors in a multi-color svg file when laying out on a grid. The gist of it is to place every layer of the incoming files on their own layers, so nothing gets combined or overwritten.</p>
<div class="language-bash highlighter-rouge"><div class="highlight"><pre class="highlight"><code>vpype <span class="se">\</span>
<span class="nb">eval</span> <span class="s2">"%layer_count=1%"</span> <span class="se">\</span>
<span class="nb">eval</span> <span class="s2">"files=[r'Demo1.svg', r'Demo2.svg']"</span> <span class="se">\</span>
grid <span class="nt">-o</span> 4.25in 5.5in 2 1 <span class="se">\</span>
	<span class="nb">read</span> <span class="nt">-a</span> stroke %files[_i]% <span class="se">\</span>
	forlayer <span class="se">\</span>
		lmove %_lid% %layer_count% <span class="se">\</span>
		<span class="nb">eval</span> <span class="s2">"%layer_count=layer_count+1%"</span> <span class="se">\</span>
	end <span class="se">\</span>
end <span class="se">\</span>
layout <span class="nt">-l</span> 8.5x11in <span class="se">\</span>
show
</code></pre></div></div>
<h3 id="recipe-breakdown">Recipe Breakdown</h3>
<p>So let’s walk through what’s happening here, step by step.</p>
<ol>
  <li>eval “%layer_count=1%”
    <ol>
      <li>layer_count is our loop variable, and since layer id values (lid) begin at 1, we’ll start this at 1 as well.</li>
    </ol>
  </li>
  <li>eval “files…
    <ol>
      <li>This describes the paths to our files. I typically use a python script to populate this line.</li>
    </ol>
  </li>
  <li>grid…
    <ol>
      <li>We’re using the -o offset flag to specify the size of each cell of the grid followed by the number of columns and rows. So in this case it’s two columns, one row, with each grid is 4.25x5.5 inches. The total size, of the design is 8.5x11.</li>
      <li>The grid command is a type of <a href="https://vpype.readthedocs.io/en/latest/fundamentals.html#block-processor-commands">Block Processor</a> meaning it automatically creates a loop and associated loop variables.</li>
    </ol>
  </li>
  <li>read…
    <ol>
      <li>We’re reading each file by accessing our files variable, at the index “_i”, which is the loop variable created by the grid command. We’re parsing this incoming file based on it’s stroke attribute using the -a flag.</li>
    </ol>
  </li>
  <li>forLayer…
    <ol>
      <li>Another <a href="https://vpype.readthedocs.io/en/latest/fundamentals.html#block-processor-commands">Block Processor</a> command, this loops through every layer in the design we just read in.</li>
    </ol>
  </li>
  <li>lmove
    <ol>
      <li>Here’s where the magic happens. We move layer _lid onto layer layer_count (our loop variable from above). This puts each layer read in on it’s own separate layer.</li>
    </ol>
  </li>
  <li>eval “%layer_count=layer_count+1%”
    <ol>
      <li>Increment the counter</li>
    </ol>
  </li>
  <li>layout
    <ol>
      <li>Center the design created by the grid command on a 8.5x11” page</li>
    </ol>
  </li>
</ol>]]></content><author><name>Eric Lewiston</name></author><category term="SVG Processing" /><category term="Vpype" /><summary type="html"><![CDATA[Vpype Grid I ran into an issue when implementing the Grid command in Vpype. When pulling in multiple files, it would often place them onto the same layers, thereby overwriting whatever color was assigned to that layer. In multi-color plots, this was a problem! Grid Recipe Here’s my solution for maintaining colors in a multi-color svg file when laying out on a grid. The gist of it is to place every layer of the incoming files on their own layers, so nothing gets combined or overwritten. vpype \ eval "%layer_count=1%" \ eval "files=[r'Demo1.svg', r'Demo2.svg']" \ grid -o 4.25in 5.5in 2 1 \ read -a stroke %files[_i]% \ forlayer \ lmove %_lid% %layer_count% \ eval "%layer_count=layer_count+1%" \ end \ end \ layout -l 8.5x11in \ show Recipe Breakdown So let’s walk through what’s happening here, step by step. eval “%layer_count=1%” layer_count is our loop variable, and since layer id values (lid) begin at 1, we’ll start this at 1 as well. eval “files… This describes the paths to our files. I typically use a python script to populate this line. grid… We’re using the -o offset flag to specify the size of each cell of the grid followed by the number of columns and rows. So in this case it’s two columns, one row, with each grid is 4.25x5.5 inches. The total size, of the design is 8.5x11. The grid command is a type of Block Processor meaning it automatically creates a loop and associated loop variables. read… We’re reading each file by accessing our files variable, at the index “_i”, which is the loop variable created by the grid command. We’re parsing this incoming file based on it’s stroke attribute using the -a flag. forLayer… Another Block Processor command, this loops through every layer in the design we just read in. lmove Here’s where the magic happens. We move layer _lid onto layer layer_count (our loop variable from above). This puts each layer read in on it’s own separate layer. eval “%layer_count=layer_count+1%” Increment the counter layout Center the design created by the grid command on a 8.5x11” page]]></summary></entry></feed>